Grafana and WebDataStudio
Two development tools run next to the app in the Aspire app host, both on by default in a new app:
- Grafana with Prometheus, Loki, Tempo and an OpenTelemetry collector: the metrics, logs and traces of every service, the app database and ready dashboards.
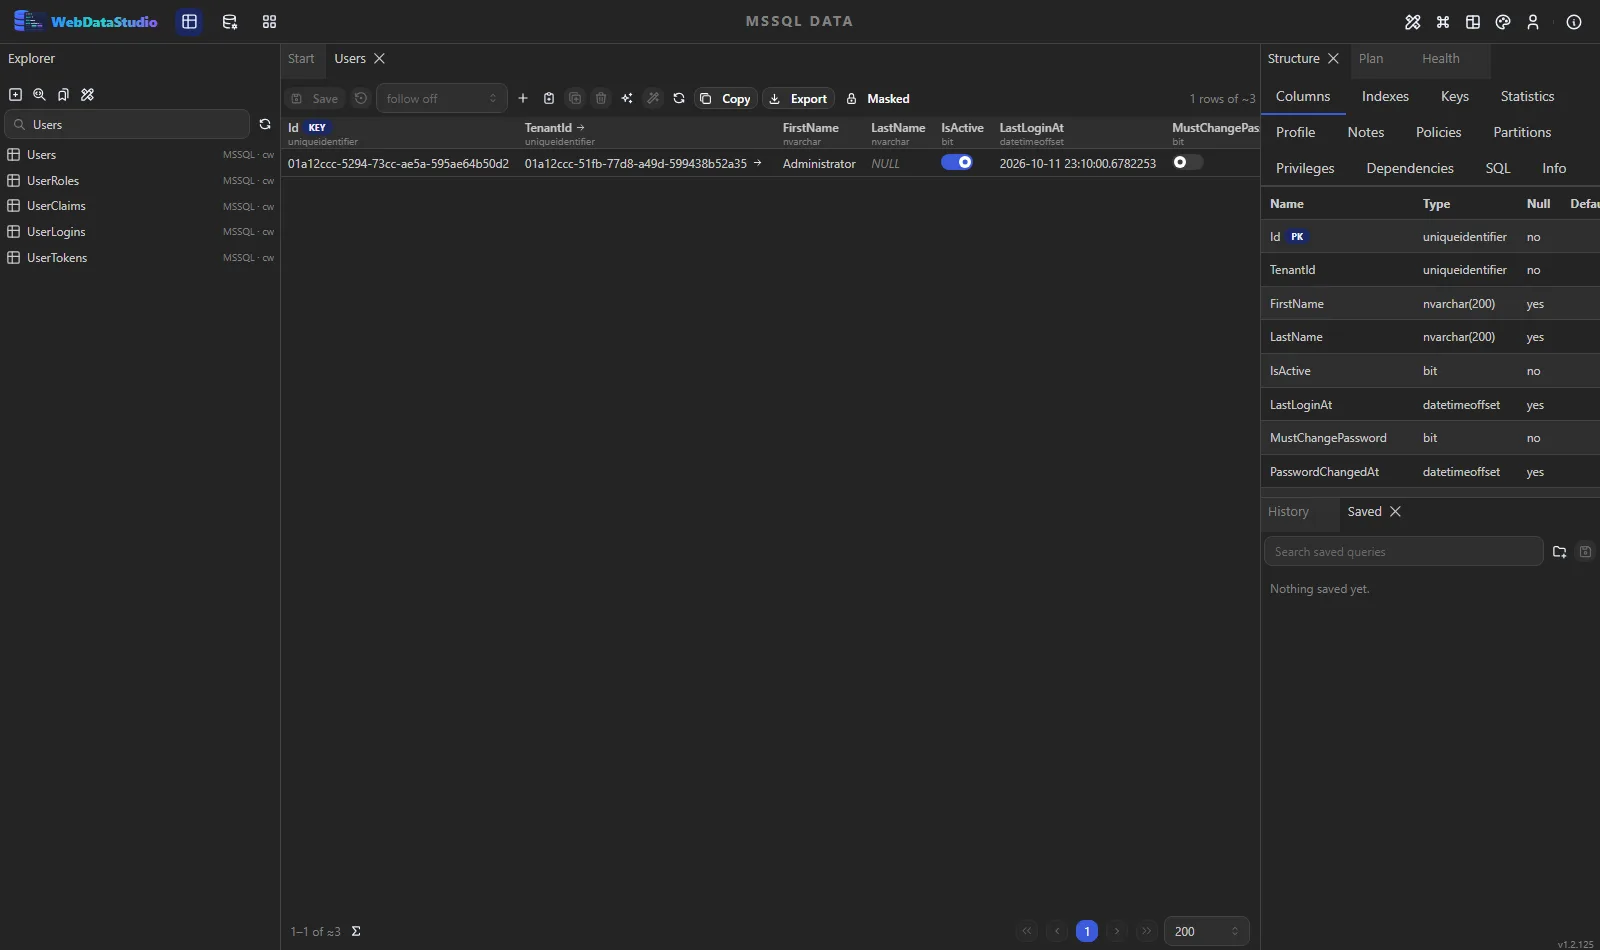
- WebDataStudio: the app database in the browser, with tables, SQL, charts and exports.
Both sign in with the app's administrator (the same email and password as in the app, see LOGIN.md) and, when Keycloak is on, with the Keycloak button as well. They come from the packages Nextended.Aspire.Hosting.Grafana and Nextended.Aspire.Hosting.WebDataStudio, which Coworkee.Aspire brings along.
What you get
| Resource | What it does |
|---|---|
grafana |
Grafana with the datasources Prometheus, Loki, Tempo and App database, and the dashboards in a folder named after the app |
prometheus |
metrics of the services, sent by the collector (7 days) |
loki |
logs of the services |
tempo |
traces of the services, with links to their logs |
otel-collector |
receives OTLP from the services and hands it to the three |
postgres-exporter |
Postgres server metrics (with Postgres only) |
webdatastudio |
WebDataStudio with the connection MYAPP to the app database |
The services keep sending to the Aspire dashboard; the generated service defaults send the same metrics, logs and traces to the collector as well (setting GRAFANA_OTLP_ENDPOINT, which the app host sets). They also record the meters of Entity Framework Core and Npgsql.
Dashboards
| Dashboard | Content |
|---|---|
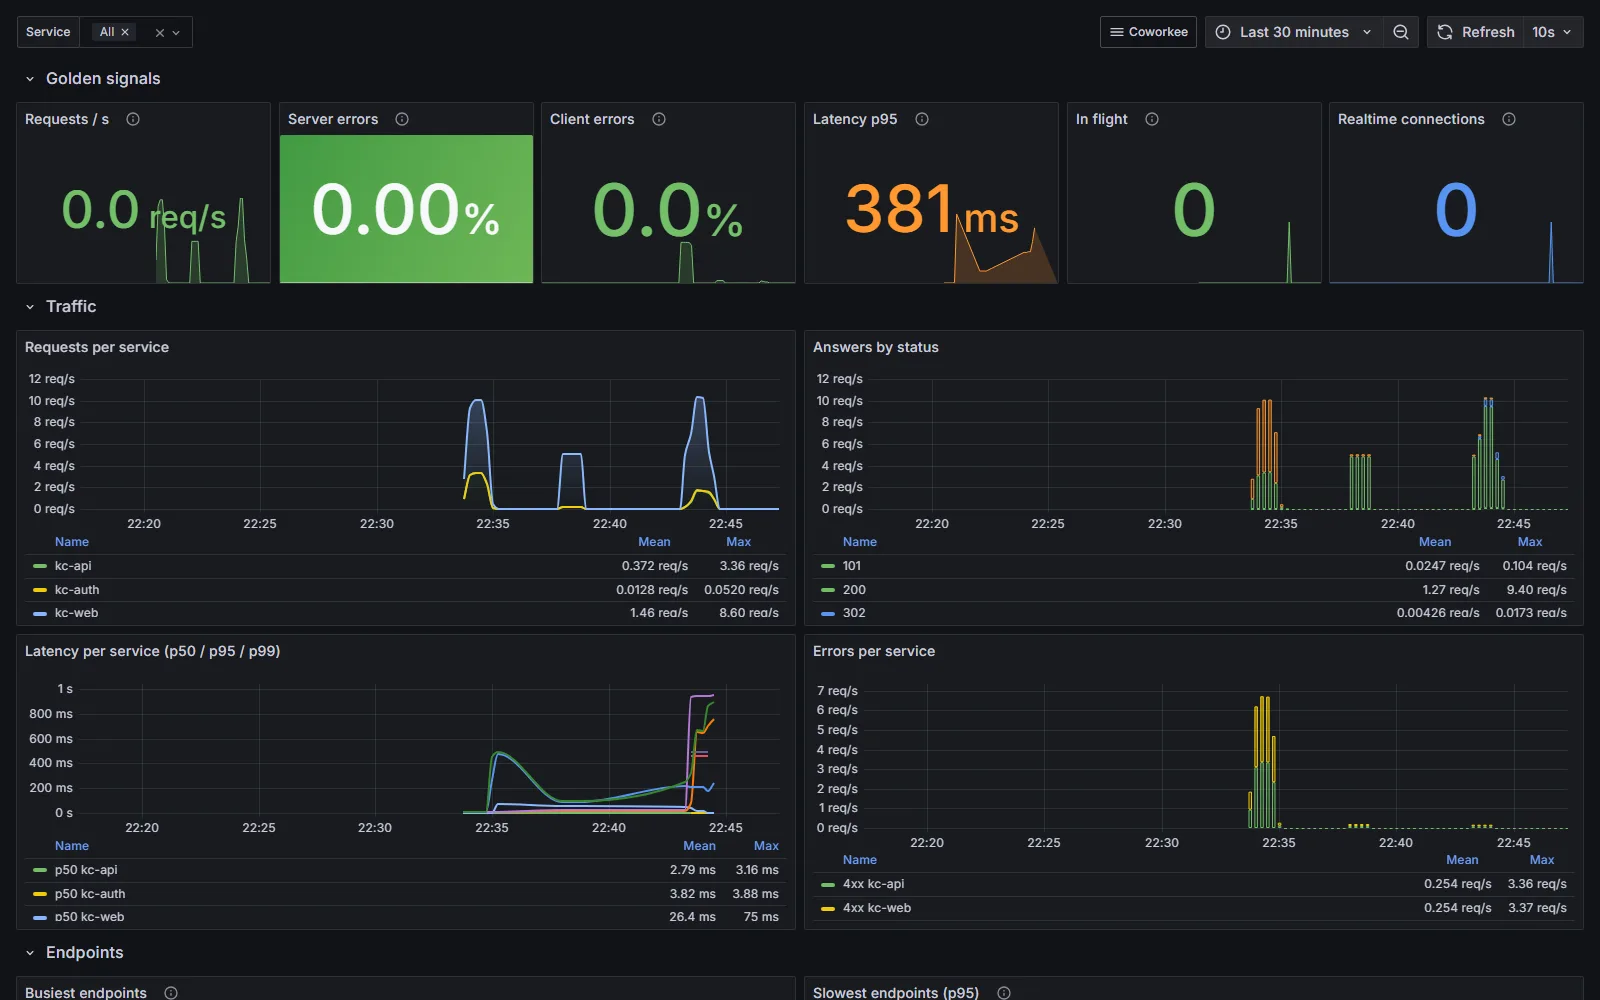
| Overview | requests per second, server and client errors, p95 latency, requests in flight, realtime (SignalR) connections; traffic, status codes and latency per service; busiest and slowest endpoints; outgoing calls; log volume, slowest traces, warnings and errors |
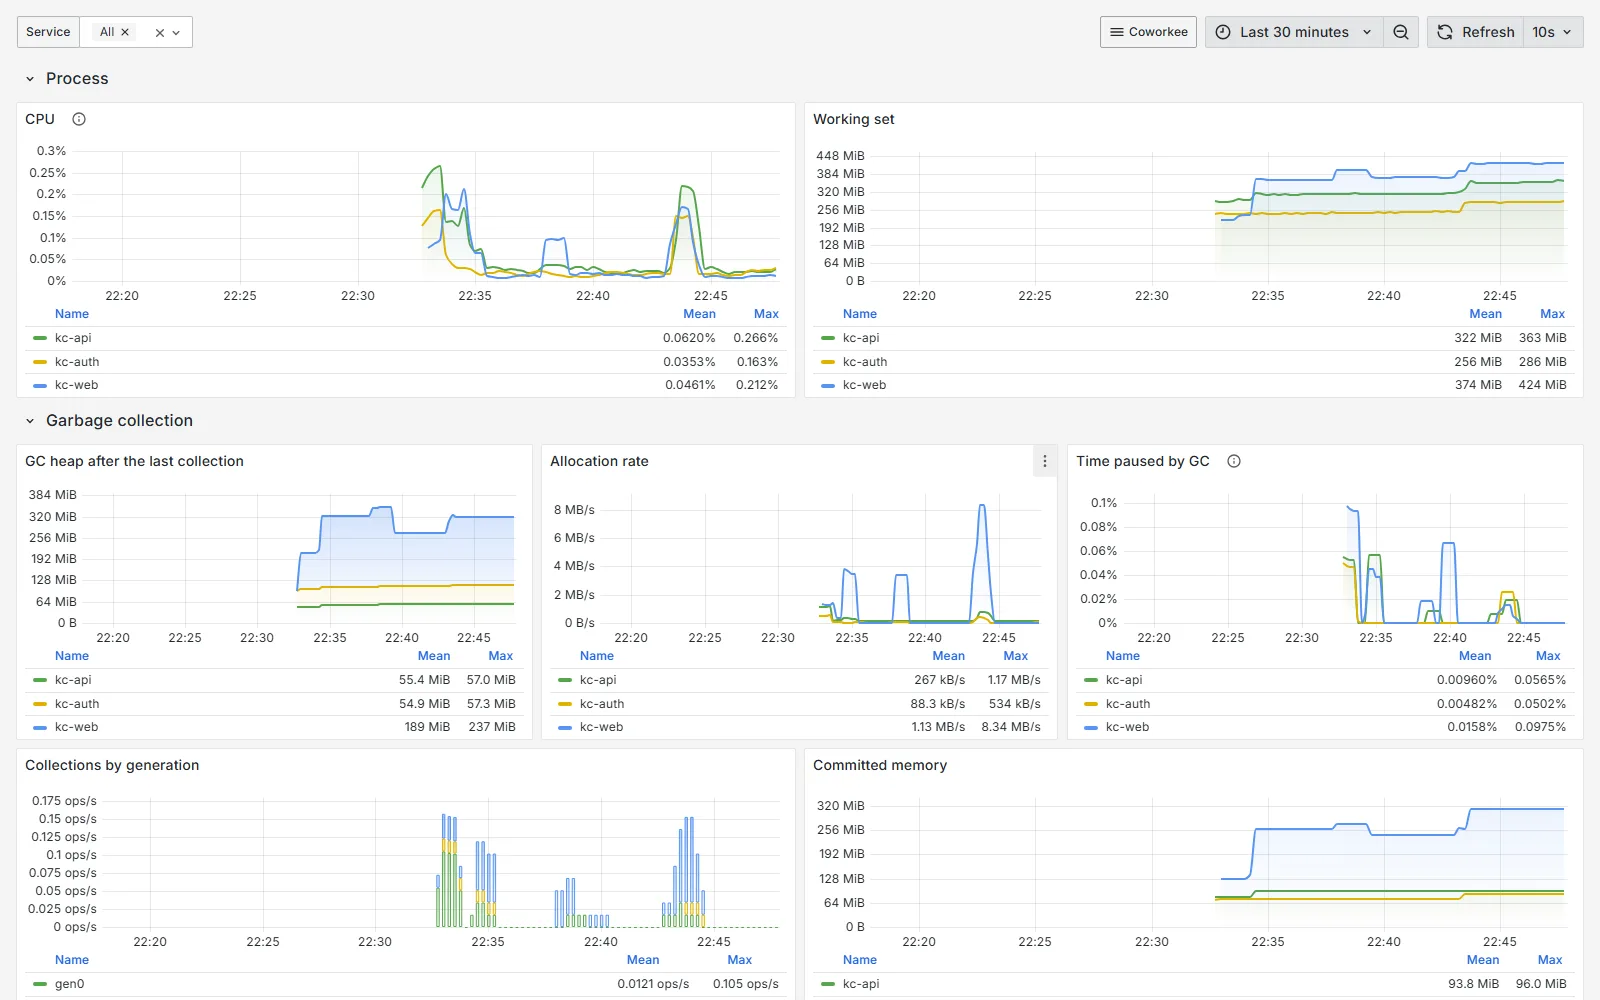
| .NET runtime | CPU, working set, GC heap, allocation rate, GC pauses and collections, thread pool, lock contention, exceptions by type, JIT |
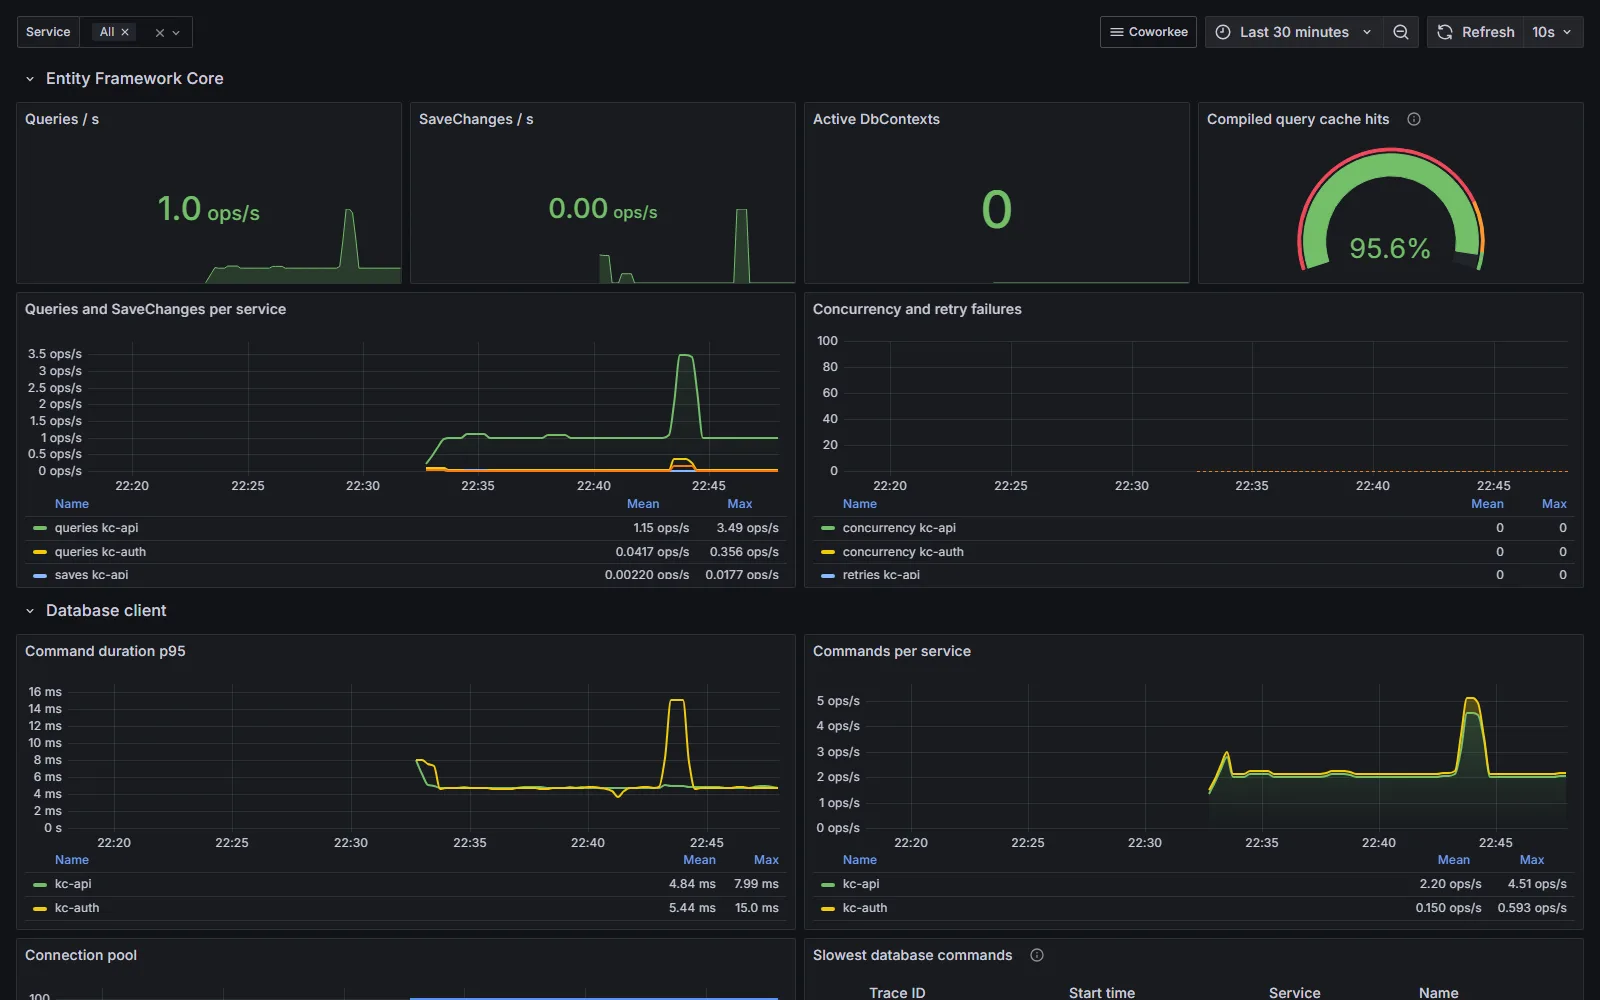
| Database access | Entity Framework Core queries, SaveChanges, active contexts, compiled query cache, concurrency and retry failures; command duration, connection pool, slowest database spans |
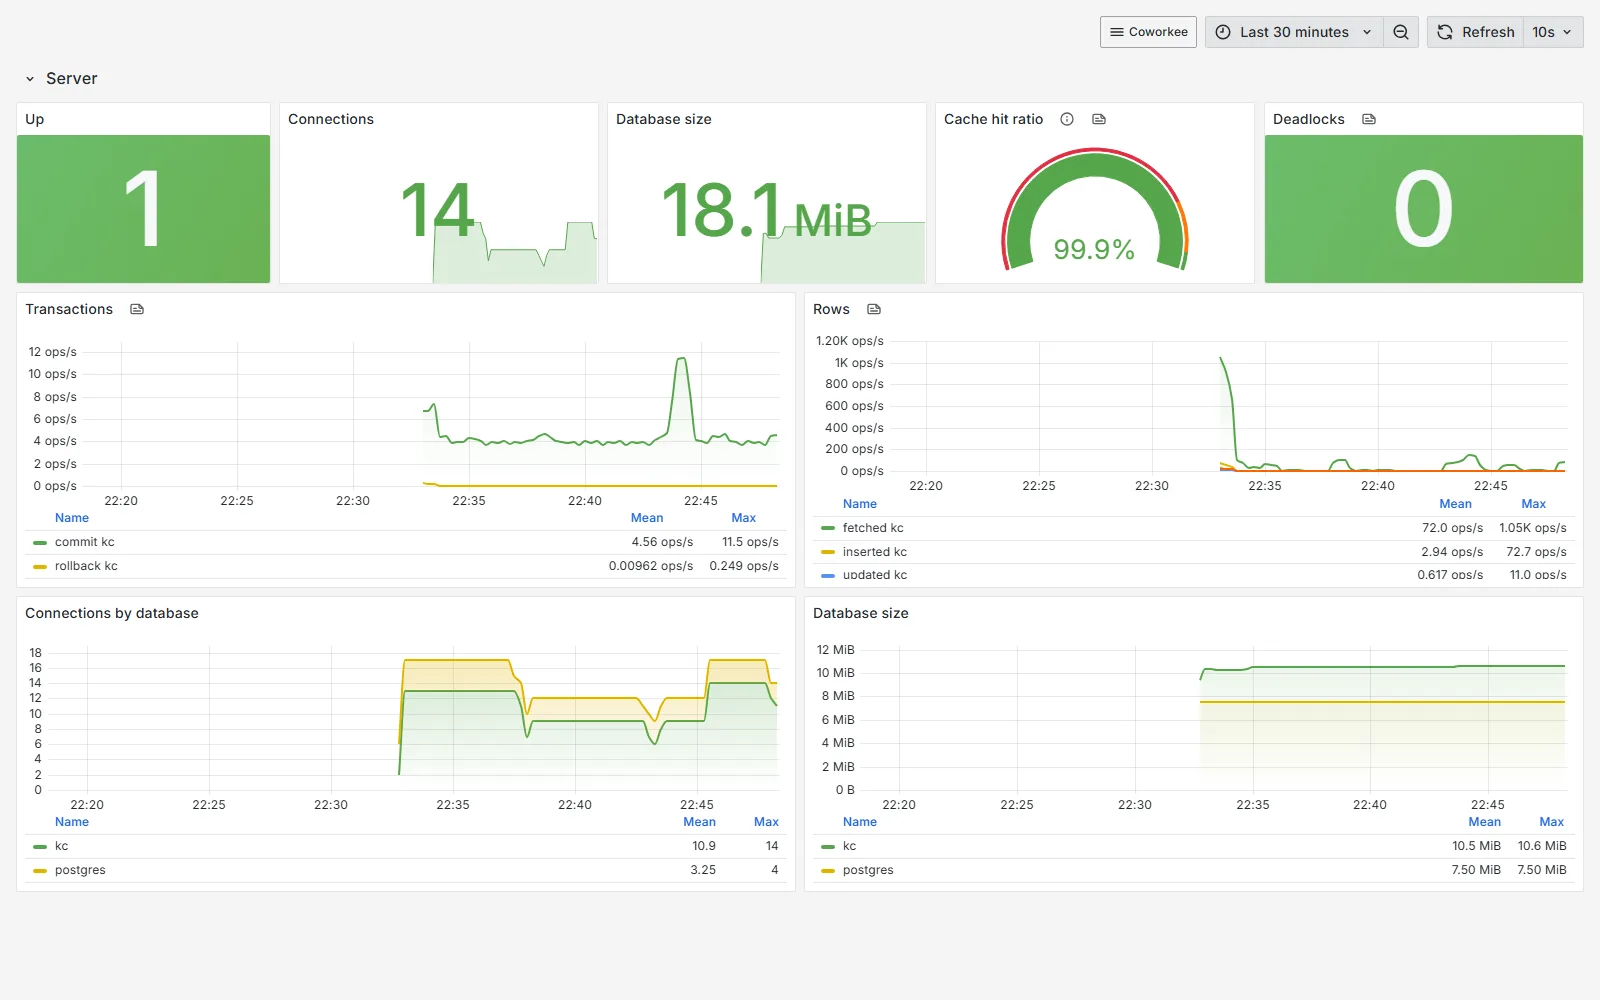
| PostgreSQL server | connections, size, cache hit ratio, deadlocks, transactions and rows per database (Postgres only) |
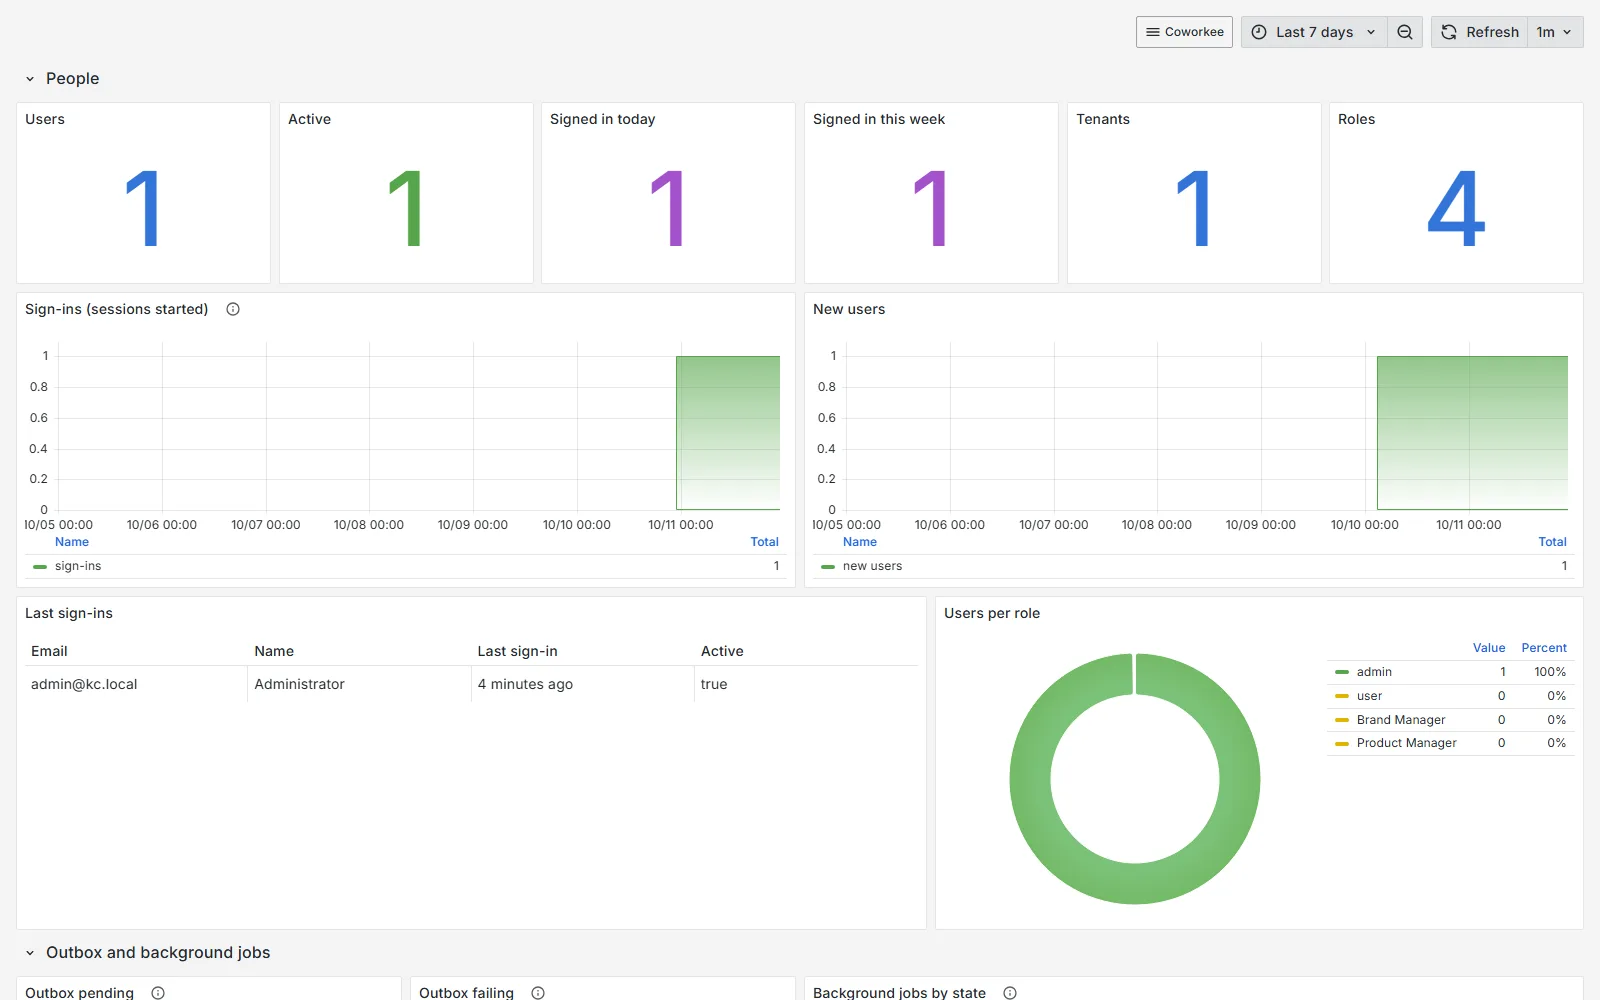
| App data | users, active users, sign-ins today and this week, tenants, roles, sign-ins and new users over time, last sign-ins, users per role, outbox pending and failing, events through the outbox, background jobs by state, open and failed jobs (Postgres and SQL Server) |
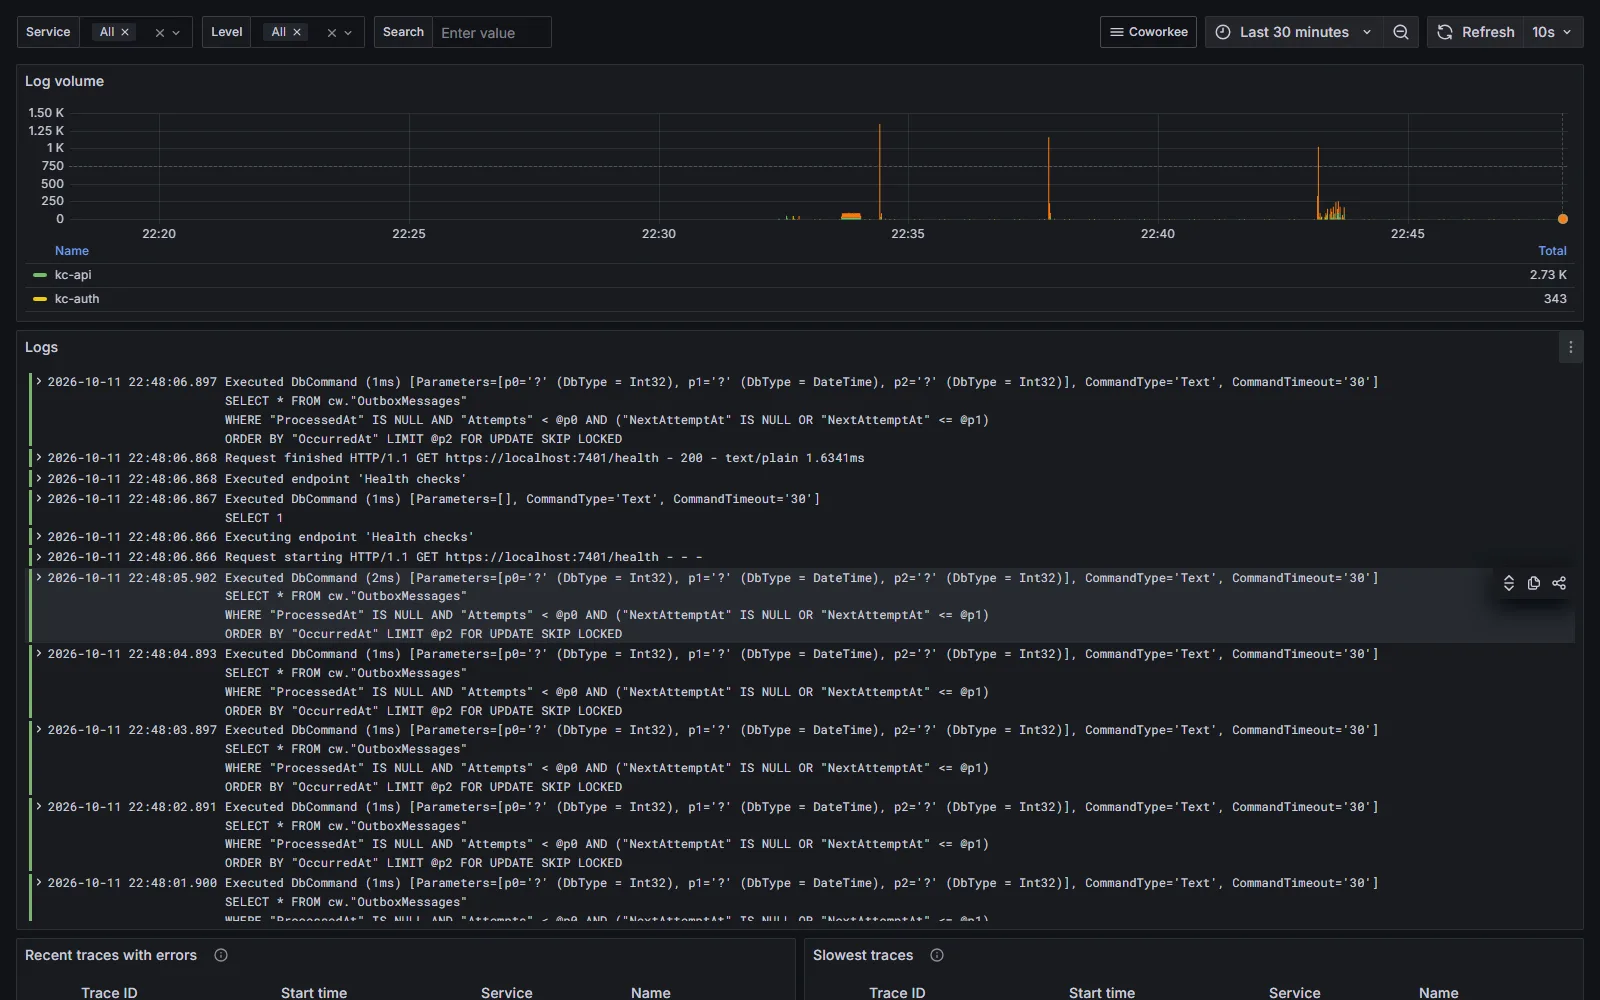
| Logs and traces | all logs with service, level and text filters, log volume per service, traces with errors, slowest traces |
Every dashboard filters by service and links to the others. They are provisioned on every start: change a copy (Save as) if you want to keep your own version.
Signing in
| Local login | Keycloak | |
|---|---|---|
| Grafana | the administrator's email and password, as Grafana server admin | Sign in with Keycloak: realm role Administrator (or the administrator's email) becomes Grafana server admin, everybody else Viewer |
| WebDataStudio | the administrator's email and password, as studio admin | Keycloak: realm role Administrator (or the administrator's email) becomes studio admin, everybody else viewer |
The generated app host takes the administrator from src/MyApp.Migrations/DemoUsers.cs, the file the seed and the Keycloak realm read too:
var administrator = DemoUsers.All.First(u => u.IsAdmin);
options.Administrator = new(administrator.Email, administrator.Password);
Without options.Administrator both tools get the user admin with a generated password: the parameter myapp-admin-password in the Aspire dashboard.
With Keycloak, the app host registers the clients myapp-grafana and myapp-webdatastudio in the app's realm with their redirect addresses, and gives the realm users their realm roles (KeycloakUser.Roles; the generated app host adds Administrator for users with IsAdmin). Every client of the realm gets the roles in the roles claim. The containers reach Keycloak over the container network, the browser through its own address: Keycloak then names itself by the browser's address (KC_HOSTNAME), so all tokens carry the same issuer.
Switching them on and off
CLI
Both options are on unless switched off:
coworkee options describes them with pros and cons.
Studio
Architecture has a card for each in Infrastructure; the presets Business app, Collaboration, SaaS platform and Everything switch both on, Local demo only WebDataStudio, Minimal neither. The containers show up in the summary on the right and on the review page.
Spec
App host
In an existing app, the lines in src/MyApp.AppHost/AppHost.cs are what switches them; delete a line (or call WithoutGrafana() / WithoutWebDataStudio()) to turn the tool off, add it to turn it on:
var app = builder.AddCoworkeeApp("myapp", options =>
{
    var administrator = DemoUsers.All.First(u => u.IsAdmin);
    options.Administrator = new(administrator.Email, administrator.Password);
    options.UseGrafana();
    options.UseWebDataStudio();
});
DemoUsers needs using MyApp.Migrations;. Both calls take a callback for the resource, e.g. options.UseGrafana(grafana => grafana.WithDataVolume()) or options.UseWebDataStudio(studio => studio.WithReadOnly()); afterwards app.Grafana and app.WebDataStudio are the resource builders.
An app created before these options also needs the second exporter in MyApp.ServiceDefaults/Extensions.cs to fill Grafana with its telemetry:
if (builder.Configuration["GRAFANA_OTLP_ENDPOINT"] is { Length: > 0 } grafana)
{
    void Grafana(OtlpExporterOptions o) => (o.Endpoint, o.Protocol, o.Headers) = (new Uri(grafana), OtlpExportProtocol.Grpc, string.Empty);
    telemetry.WithLogging(l => l.AddOtlpExporter("grafana", Grafana)).WithMetrics(m => m.AddOtlpExporter("grafana", Grafana)).WithTracing(t => t.AddOtlpExporter("grafana", Grafana));
}
Here telemetry is the builder.Services.AddOpenTelemetry() builder, and the Aspire dashboard exporter is added per signal (AddOtlpExporter()) instead of UseOtlpExporter(), which cannot be combined with a second exporter.
Databases
| Database | Grafana | WebDataStudio |
|---|---|---|
| Postgres | datasource App database, postgres_exporter, all dashboards | connection to the database |
| SQL Server | datasource App database (user sa), all dashboards but PostgreSQL server |
connection to the database |
| SQLite | no database datasource and no App data dashboard | the database file, mounted from .data |
UseDatabase(...) |
no database datasource | connection with the supplied connection string |
Development only
Both tools are added in run mode only: aspire publish and azd up leave them out, because a deployment brings its own monitoring and should not expose a database studio with the administrator's password. Generated configs land in src/MyApp.AppHost/observability/.generated (ignored by git).