Reporting
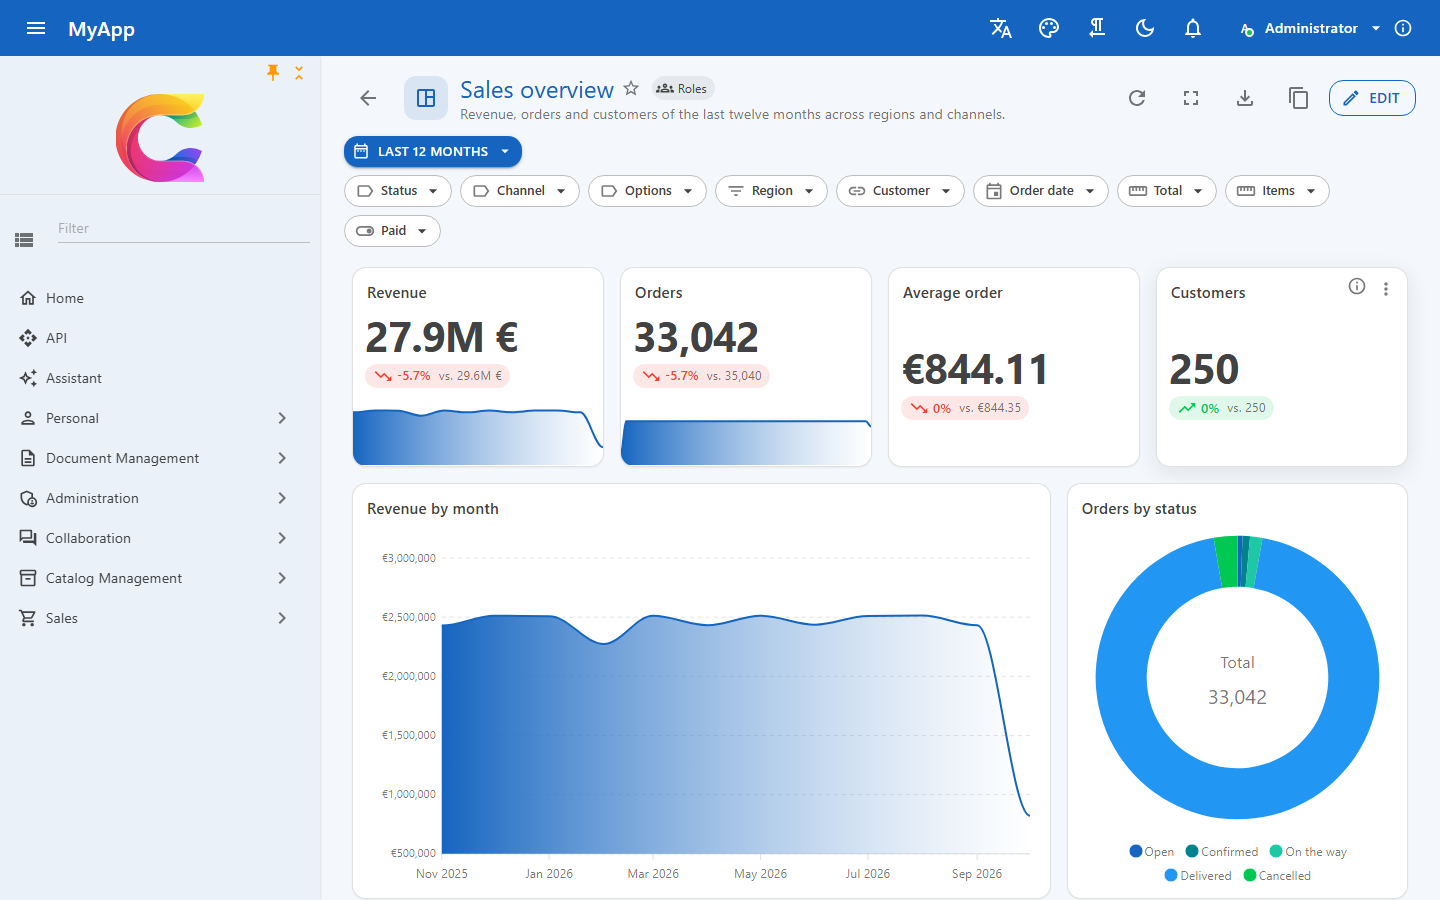
Coworkee.Reporting (server) and Coworkee.Client.Blazor.Reporting (client) add dashboards over the OData entity sets of your app. Users arrange widgets on a grid, filter them together, click a bar to narrow the rest and share the result with roles or the whole organisation. Every number is aggregated by the database, so a dashboard over 100,000 rows answers in a few milliseconds.
Setup
// API: the module brings tables, endpoints, permissions and live updates
[DependsOn(typeof(CoworkeeReportingModule))]
public sealed class MyAppDatabaseModule : CoworkeeModule;
// WebAssembly client: pages under /reports and the "Reports" navigation entry
builder.Services.AddCoworkeeReporting(baseAddress, reports => reports
    .DrillDown("SalesOrders", "sales/orders")      // "Open the data" lands on your page with the widget's filter
    .DrillDown("Products", "catalog/products"));
Add typeof(Coworkee.Client.Blazor.Reporting.ReportingOptions).Assembly to the router's AdditionalAssemblies (in Routes.razor and in AddAdditionalAssemblies of the web host) and create a migration for the tables cw.Reports and cw.ReportFavorites. New apps get all of this with the template option --reports (on by default).
Your entity sets as data sources
Reports use what you already registered for OData, nothing else:
services.AddODataEntity<SalesOrder>("SalesOrders", SalesPermissions.Orders.View);
services.AddODataEntity<Customer>("Customers", SalesPermissions.Orders.View);
- Fields come from the EDM: properties hidden with
AddODataEntity(..., o => o.Secret)never show up, neither as field nor in a filter. - Navigation properties to another registered set add its fields, e.g.
Customer/Name; the user needs the permission of that set too. - Labels come from
[ProvideFacet(Label = ...)],[Display(Name = ...)]or the property name; enum members show their[Display]names. - Rows are the ones the OData list returns: tenant filter, soft delete and every
IODataEntityFilter<T>apply. A user without the set's permission gets a 403 for widgets on it, the rest of the report still works. - Entities with
[Realtime]refresh open dashboards when their rows change.
GET /api/v1/reports/sources lists the sets and fields the signed-in user may use.
Server side aggregation
Widgets send a query model, never an expression:
POST /api/v1/reports/query
{
  "entitySet": "SalesOrders",
  "filter": "Region eq 'Nord' and Total gt 100",
  "groupBy": { "field": "OrderDate", "bucket": "Month" },
  "splitBy": { "field": "Channel" },
  "aggregates": [ { "function": "Sum", "field": "Total" }, { "function": "Count" } ],
  "sortBy": "Value", "descending": true, "top": 10
}
The server checks every field against the source, builds GroupBy and Select with expression trees and lets EF Core translate them to SQL. The filter is OData $filter, parsed against the EDM like on the OData endpoint. Each group comes back with an OData filter for exactly its rows, which the client uses for cross filters and drill-down.
| Group by | any field, two at most (categories and series); dates by Day, Week (Monday), Month, Quarter, Year |
| Values | Count, Sum, Average, Min, Max (numbers), DistinctCount (any field), up to 8 |
| Limits | 5,000 groups, top 1 to 1,000 |
| Rejected | unknown or hidden fields, sums of text, buckets on non-dates, OData that does not parse |
All three database providers aggregate in SQL. On SQL Server weeks are counted with DATEDIFF from a Monday, as its day of week depends on server settings. EF's SQLite provider stores DateTimeOffset as text without date parts, so SQLite rejects date buckets of DateTimeOffset fields (DateTime and DateOnly work); use Postgres or SQL Server for them.
Measured on the demo's 100,000 sales orders (Postgres, warm): count by status 9 ms, sum by month 29 ms, count by week 55 ms, region by channel 23 ms, top 10 customers with join 30 ms, four KPI values 58 ms.
Widgets
| Widget | Shows |
|---|---|
| KPI | one value with trend against the period before, a curve over time and a gauge towards a target |
| Chart | bar, horizontal bar, stacked bar, line, area, pie, donut, scatter, radar, treemap, heatmap; dates on a time axis |
| Table | rows of the set with endless scrolling (each scroll loads the next page), sortable, as table, cards or list |
| Data table | the library's CoworkeeDataTable: paging, grouping, column chooser, facets, search |
| Pivot | categories as rows, series as columns, shaded by size, with totals |
| Text, image, web page | Markdown (HTML is not rendered), an image or a sandboxed page from an http(s) address |
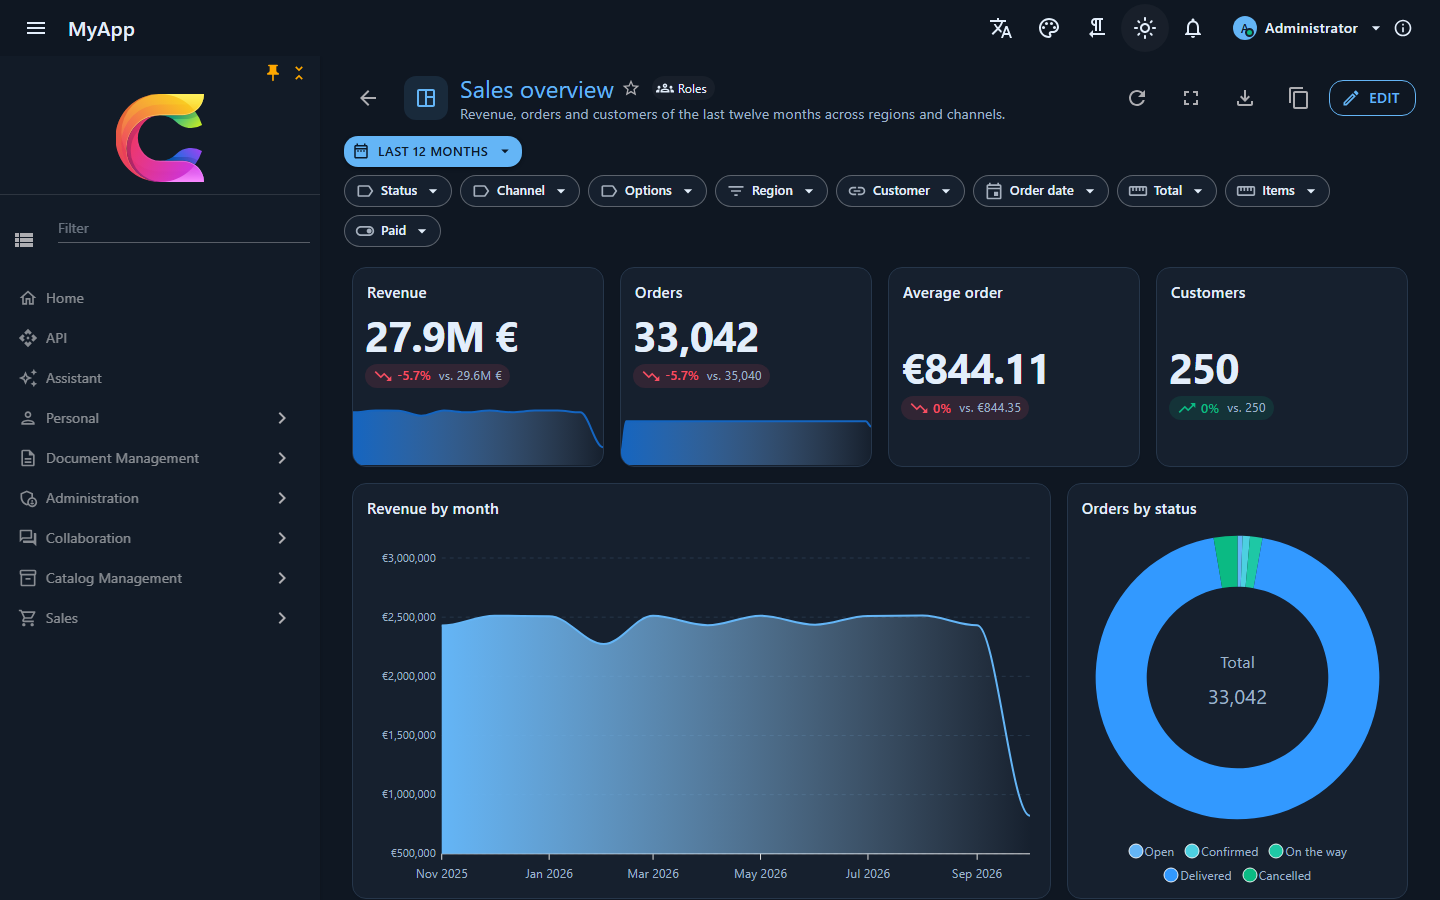
Charts use Blazor-ApexCharts: maintained, animated and good looking out of the box, with click events for cross filters. Colours, font and dark mode come from the MudBlazor theme's CSS variables, so custom themes need no extra setup.
Designer
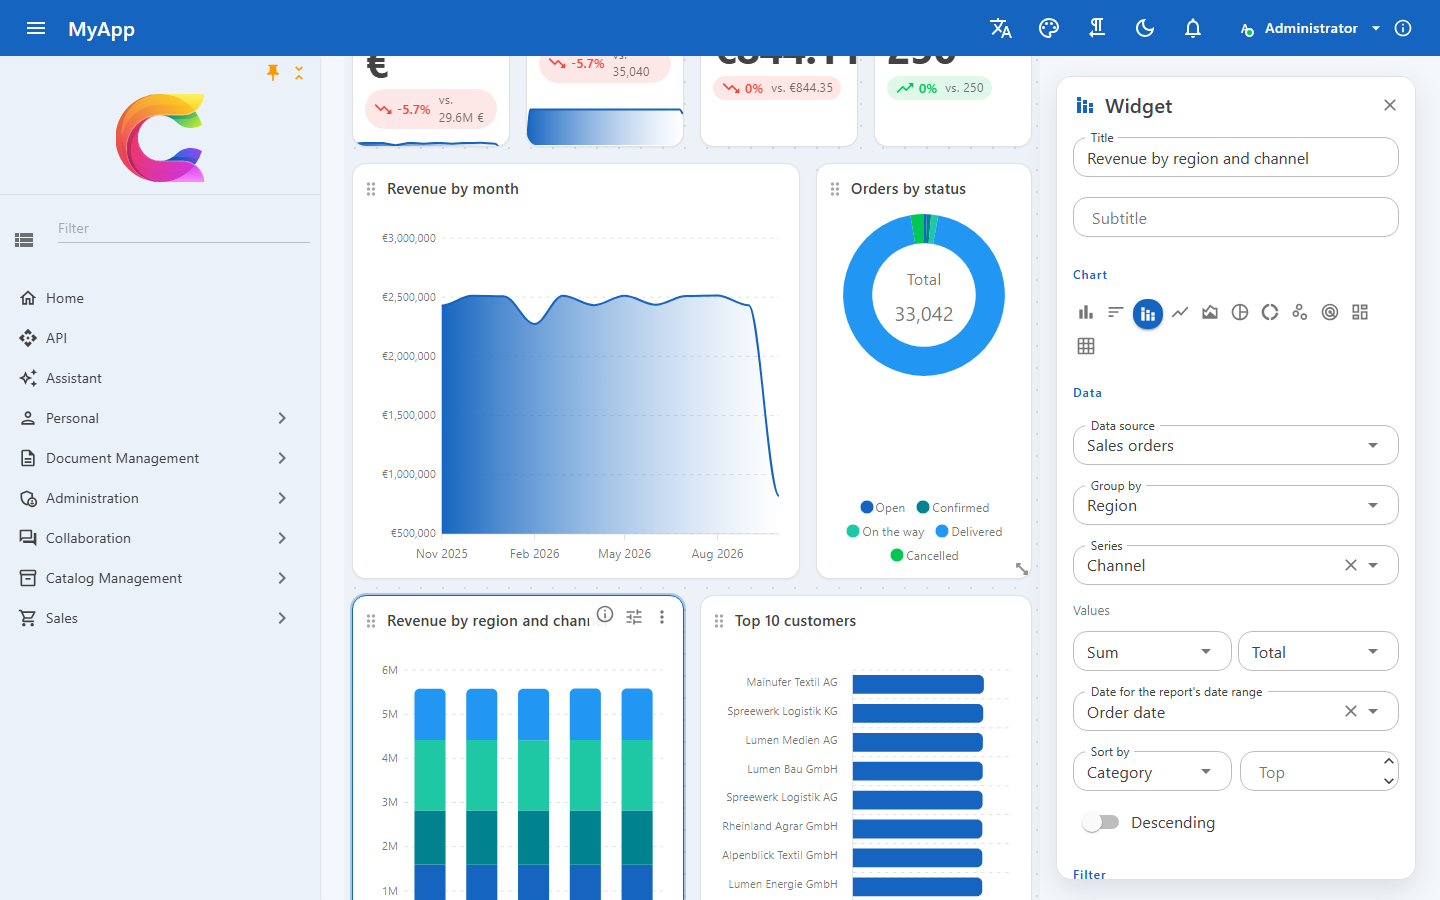
- Edit switches the grid into edit mode: drag widgets by their title, resize them at the edges, add new ones from Add widget. The layout uses GridStack with 12 columns and falls back to one column on phones.
- The widget panel edits data source, group by, series, values, sort, top, the date field for the report's date range, facets and rules of the query builder, number format, target, legend and more; the widget redraws while you change it.
- Undo and redo cover every change until you save. Report settings hold name, description, icon, sharing and the refresh interval.
- View mode: date range for all widgets, facets per entity set, cross filters by clicking a bar, slice or pivot cell, Open the data on every widget, full screen per widget, presentation mode, refresh, export.
Filters
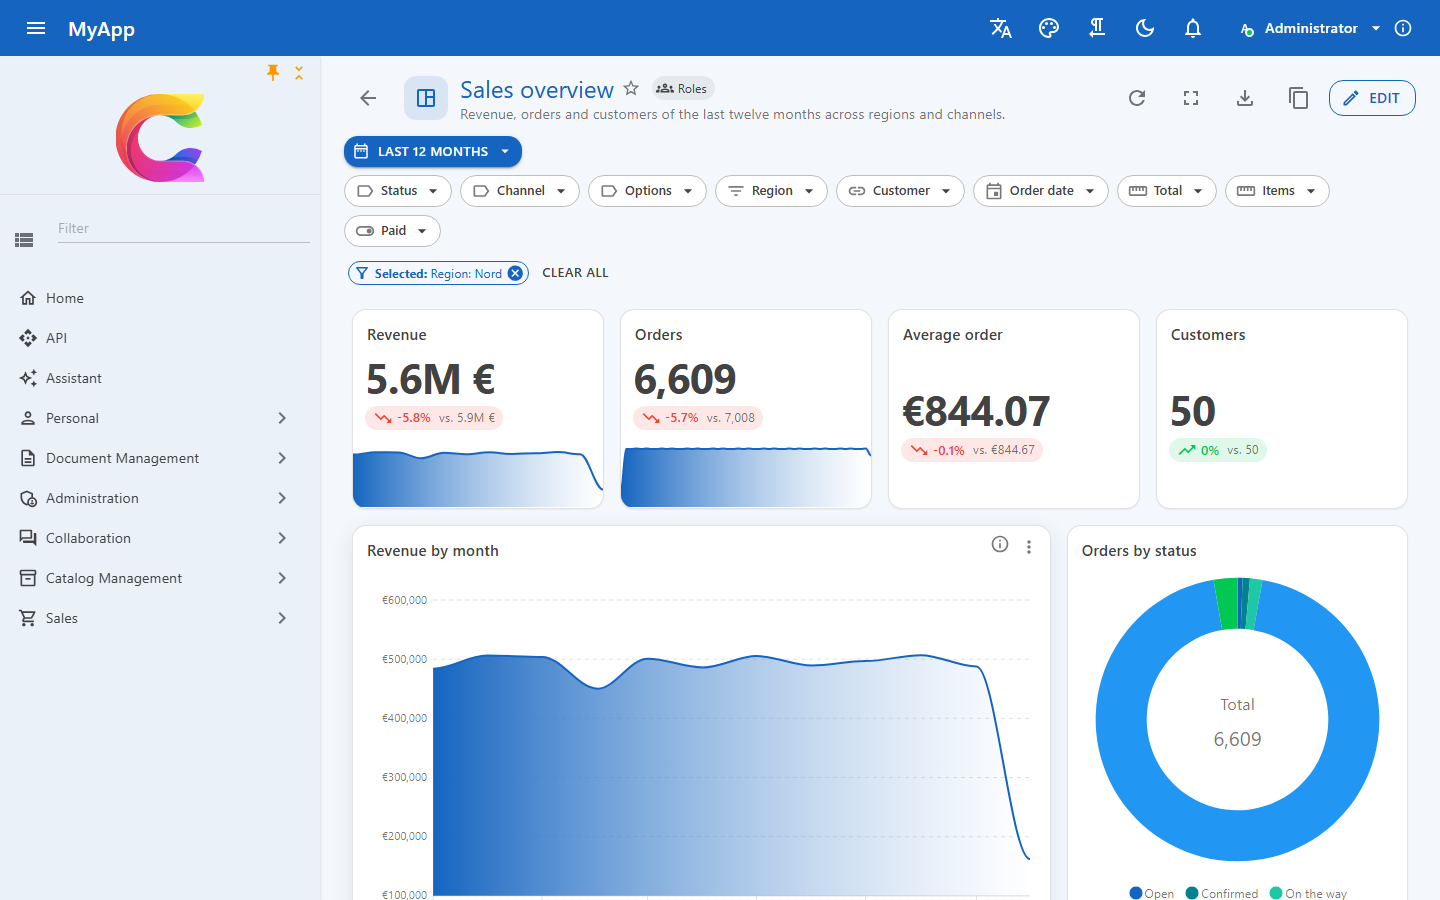
A widget's rows are narrowed by, in this order: its own query builder rules and facets, the report's facets for its entity set, the report's date range on the widget's date field, and the cross filters of other widgets on the same set. Facets and date range are part of the report and saved with it; cross filters are for the moment.
Sharing and permissions
| Permission | Allows |
|---|---|
Reports.View |
open reports shared with you, favorites |
Reports.Manage |
create reports, change and delete your own, duplicate any you can open |
Reports.Share |
share with roles or the organisation |
A report is private, shared with roles (holders of one of them, directly or through groups) or with the organisation. Only the owner changes it; others duplicate it into a private copy. A change reaches everyone who has the report open, over the realtime hub.
Export
- Report: image (PNG), PDF through the browser's print dialog (print styles hide navigation and tools) and the report file (
.report.json) to import elsewhere. - Widget: CSV and Excel of what it shows; tables export their loaded rows.
Endpoints
| Endpoint | |
|---|---|
GET /api/v1/reports |
reports you can open, favorites first |
POST /api/v1/reports, PUT /api/v1/reports/{id}, DELETE /api/v1/reports/{id} |
create, change, delete |
POST /api/v1/reports/{id}/duplicate, PUT /api/v1/reports/{id}/favorite |
copy, favorite |
GET /api/v1/reports/sources, GET /api/v1/reports/roles |
fields per set, roles to share with |
POST /api/v1/reports/query |
aggregate |
POST /api/v1/reports/sheet |
rows to an Excel workbook |